Hi everyone. As you all know, my work in class is all done in Processing. I thought it would be good to also mention other tools designers can use in somewhat similar ways to Processing. Maybe these are tools you would want to check out for the future? This will also be on my processing blog in greater detail - I thought that people interested in Processing would also want to know what else is out there. I haven't found a good source that lists them all together in a clear way.
openFrameworks (oF) - I have not yet made anything with openFrameworks but it seems like the openFrameworks library and the Processing library have many similarities. Just as Processing is built upon Java, openFrameworks is built upon C++. Unlike Processing, openFrameworks does not have an IDE built in.
pure data (pd) - Pure data was introduced to me by Pat Pagano. He's worked with it forever and uses it to create immersive visuals, control lighting, and create interactive art. I have done a little work in pure data. Pure data is a graphical programming language - the programs you create look like flow charts rather than lines of text.
Wednesday, March 31, 2010


Tuesday, March 30, 2010
Zwinky follow up

Finally, this took more than 24 hours.
Funny the adventures we go through until something digital can be finally visualized.
Monday, March 29, 2010
Comment Flow: Visualizing communication along a network path
The article gets to the heart of the major weakness of social networking sites to actually replicate a real life social circle in that as the article states social networking sites treat "All friend links are equal, and usually equally visible to public. The information is not very reliable - extra information
is required to acknowledge the highly differentiated nature of human relationships."
The article than goes on to propose plausible solutions to this problem. Through examination of major social networking platforms the author concludes that to apply algorithims to more accurately and organically represent people you are truly friends with is through comment analysis. That a system could crawl the people you converse with and comment with the most could represent those people as closer friends.
is required to acknowledge the highly differentiated nature of human relationships."
The article than goes on to propose plausible solutions to this problem. Through examination of major social networking platforms the author concludes that to apply algorithims to more accurately and organically represent people you are truly friends with is through comment analysis. That a system could crawl the people you converse with and comment with the most could represent those people as closer friends.
Get Your Walk Score
Enter your address at http://www.walkscore.com/ and you can view the 'walkability' of your house based on nearby amenities. You get a score, a map of amenities, and a percentage of residents with a higher walk score than yours - mine is 62.
Defeating the Dark Side of Social Media
I came across this article in Business Week, which I found interesting about social media and companies. Even though, social media has been around for many years now, companies are still struggling with the expanded reach of users-generating content. It seems that companies are always slower to catch up then consumers. While I was looking for inspiration for my project on user-generated content and tourism, I was really surprised how far behind some companies are. The companies seem to either do it poorly or just pretend it doesn't exist. Although, I think as social media increases more companies will be unable to ignore it.
Customizable Cartoon
This customizable cartoon is from Zwinky. You can create cartoon characters, cloth them with all kinds of accessories, give them whatever skin color you wish, chose their hair type, their gender, etc.
I don't why the picture does not show. Perhaps the security settings of the computer.
I'll show you tomorrow in class.
I don't why the picture does not show. Perhaps the security settings of the computer.
I'll show you tomorrow in class.
Saturday, March 27, 2010
Visualizing the newspaper of the future...
After listening to Arielle Emmett's presentation yesterday I started wondering what role, if any newspapers will play in the future. I don't think they will exist. It seems like so many times I hear journalists talk about the future of media they seem like a bunch of suits running scared of an obvious regime change.
Emmett mentioned that losing newspapers could be a threat to our very democracy. I highly doubt it. Isn't blogging the most democratic form of news? I think the news media has to resign themeselves with the fact that they can't compete with some kid with a camera phone. Plus, they need to recognize that good writing can come from anywhere and not all of these staff writers are publishing anything worth reading.
Emmett mentioned that losing newspapers could be a threat to our very democracy. I highly doubt it. Isn't blogging the most democratic form of news? I think the news media has to resign themeselves with the fact that they can't compete with some kid with a camera phone. Plus, they need to recognize that good writing can come from anywhere and not all of these staff writers are publishing anything worth reading.
Thursday, March 25, 2010
Fibonacci Spiral
Arturo I know you're a fan of the golden ratio, thought you might like this iteration of it for your collection:

Tuesday, March 23, 2010
See You in the Funny Papers: Cartoons and Social Networks
This reading resonates in me. Social networks have completely change my life. Before hi5 and facebook I was simply a shy person thriving to make new friends. Well, I had my colleagues from my years at the university but most of the time we had different interests. Figure 3 shows a cartoons that made me smile: Because of networking sites I needed a new address book. One interesting thing is when you meet someone in the street and you both stare at each other until you remember that this is one of these "new" friends.
At the same time, I think that these relationships created by networking on the web can create a toll on "real" relationship. For instance, the more people I meet that are more like me the more I lean towards them instead of getting closer to my non-virtual friends. If it was food, I would say that networking satisfies soul's craving. And I think that the cartoons on p 6 portray that perfectly! And the sky (sorry), the world wide web is the limit!
One other great thing that i like about networks is that it offers the opportunity to truly know the other person. Don't need years to figure out who that person is truly; the history of a wall on Facebook tells all.
Besides networking is great when one is working on a project. I usually simply update my status and ask for help. I have FB friends that have more than five thousands friends thus I will ask them to borrow their status for 2 hours when I need feedback; and people are usually eager to help. Figure 18 totally shows how circular network connections are.
At the same time, I think that these relationships created by networking on the web can create a toll on "real" relationship. For instance, the more people I meet that are more like me the more I lean towards them instead of getting closer to my non-virtual friends. If it was food, I would say that networking satisfies soul's craving. And I think that the cartoons on p 6 portray that perfectly! And the sky (sorry), the world wide web is the limit!
One other great thing that i like about networks is that it offers the opportunity to truly know the other person. Don't need years to figure out who that person is truly; the history of a wall on Facebook tells all.
Besides networking is great when one is working on a project. I usually simply update my status and ask for help. I have FB friends that have more than five thousands friends thus I will ask them to borrow their status for 2 hours when I need feedback; and people are usually eager to help. Figure 18 totally shows how circular network connections are.
Monday, March 22, 2010
Project Update
As I do not have a whole lot new to show at this point I'll just give a brief update. I'm using Unity for my solar visualizer as it is capable of creating a 3d environment that is interactive allowing me to link actions to objects such as a sun, which is linked to a position calculator that updates continuously... and it's free. Also, I am using a book from my solar engineering course I had last semester to help me calculate things like solar flux on an inclined surface which leads to power output, collector area, ext.
Visualization paper
Hi everyone. As the resident painter in the class, my Visualization paper is about contemporary art and the use of Photoshop. I am writing a longer paper because I hope to submit it to a few journals. So I don't think I will have it completely done by tomorrow, though it is getting quite long. The artists I am focusing on mainly are Cory Arcangel and Julie Mehretu. David Hockney and Kevin Appel's work will also be mentioned to a lesser degree. I was wondering if the class had any insight on other artists that could be mentioned to compare or contrast? They do not have to necessarily present their work digitally but they do have to maybe illustrate or demonstate something to do with Photoshop. For example, I'm using an article about Leonardo's presentation drawings to support some of my research. I know our class thinks very out of the box so I hope someone can give me insight for a new angle!
Good example of strong Visual Design
Check out this site http://www.stanick.com/. I found it accidentally, It's by an artist named Peter Stanick. The site is an artwork in itself. Try clicking through it I could never get it to repeat. The sites strength as an artwork lies in its cohesion in its design as well as its depth of execution.
Sunday, March 21, 2010
Geo-positionning across the years
In order to revise my visualization paper, I have been reading about geo-positionning. I found and interesting article quite old but that I think is a good summary. It is when reading such articles and comparing to what is feasible today (remember the video on bing's maps) that we can see how technology is evolving very fast. Many expectations have been realized such as the 3D visualization, the improvement on the quality of the pixels etc.
The references sections also list some helpful websites.
Read it Here


The references sections also list some helpful websites.
Read it Here
processing progress
For this class I am working on presenting all of my Processing sketches in one place. The most user-friendly way to do this was to create a blog that also functions as an interactive portfolio. Plus, I plan to continue working in Processing and updating the blog portion with information as well as great resources. Blogger seemed like an obvious choice and something I could upgrade as much or as little as I would like - wordpress was another option but seems to reject a lot of simple html editing as well as not displaying the java applets correctly.* I'm still working on how everything looks but please check out http://processingprogress.blogspot.com/ . These sketches will also be on http://www.openprocessing.org/ because I hope to work collaboratively in the future with other artists.
*It seems like a lot of people have had similar problems with wordpress from what I have looked at online. Will blog more on that later.
*It seems like a lot of people have had similar problems with wordpress from what I have looked at online. Will blog more on that later.
Visualizing Culture and Those Who Are Different From a Communication Perspective
For my paper, I focused on Visualizing Culture and Those Who Are Different From a Communication Perspective. While writing my paper, I came across a really interesting project/application from National Geographic called The Genographic Project. The Atlas of the Human Journey section shows how cultures have spread. This might be interesting for those interested in tracing their ancestry. Hope everyone finds this as interesting as I did.
Project Talk and Call For Help
"You sick little monkey!"
If you speak the exclamatory sentence written above, you will find there are certain words that will be stressed and some will be spoken as if 'gliding" through. When this feature is measured along time, we call it the rhythm of speech. The remark- "You sick little monkey!", possibly expressed with some surprise, may also have elements of amusement in it, in which case one will use pitch variation (intonation) to highlight that emotion. These elements of stress, rhythm, intonation constitute the prosody which among other things, defines the emotional mood of the speaker and rhetorical aspects like sarcasm, humor, irony etc.
I am hoping to annoy few linguists here with my very crude understanding of language,speech and the whole deal! If you are annoyed, please help me understand the concepts better.
So how does one study these elements rigorously? Researchers have found few features of speech which can be mapped to various prosodic elements.
I will try to explain in plain english what I have understood so far from various research papers.
Generally taken as units larger than phonemes, when these features/elements are studied rigorously as global statistics, they are studied as contours of mean value, standard deviation of fundamental frequency, energy distribution, and temporal changes in spectral coefficients like jitter and tremors, and sometimes when studied locally- pitch and energy contours.
So where does emotion fit in the above gobbledygook??
It has been found that sadness has been associated with low standard deviation of pitch and slow speaking rate, while anger implies higher pitch deviation and rate. But by just studying pitch deviation and speaking rate, one is most likely to fall in a trap of prosodic confusion rather than discern emotional qualities from it. For example, an interrogative sentence will most likely have wider pitch contour than affirmative sentence, which mean interrogative sentences will have higher standard deviation, which has nothing to do with emotional content!
So these measures of deviations and statistics are necessary conditions- but not sufficient conditions!
Therefore, researchers are toying with something called Hidden Markov Models(HMM), which works with state transitions. To study temporal behaviours of speech, not as stationary statistics but as concatenation of states of local feature statistics.
So far, people have experimented with different features of speech, running one or more HMM on one emotion, short time, semi continuous models and various kinds of mathematical frameworks.
Frankly, for this class project, I would be happy to just use someone's software just like a text to speech conversion software. But I cannot find any ready-to-use software for emotion recognition. Therefore, I am hoping to implement one such model before the end of the semester. But so far, no work to show!
Arturo suggested that I look from the eye of an artist or better yet; "hear from the ear of an artist", rather than work with obscure statistics and mathematical models. Or at least that's what I understood from that inspiring talk with Arturo! :)
I would request people to suggest ideas on different perspective to this problem of emotion recognition. People with music background? Sound engineers? theatre? Linguists? Psychics?!
If you speak the exclamatory sentence written above, you will find there are certain words that will be stressed and some will be spoken as if 'gliding" through. When this feature is measured along time, we call it the rhythm of speech. The remark- "You sick little monkey!", possibly expressed with some surprise, may also have elements of amusement in it, in which case one will use pitch variation (intonation) to highlight that emotion. These elements of stress, rhythm, intonation constitute the prosody which among other things, defines the emotional mood of the speaker and rhetorical aspects like sarcasm, humor, irony etc.
I am hoping to annoy few linguists here with my very crude understanding of language,speech and the whole deal! If you are annoyed, please help me understand the concepts better.
So how does one study these elements rigorously? Researchers have found few features of speech which can be mapped to various prosodic elements.
I will try to explain in plain english what I have understood so far from various research papers.
Generally taken as units larger than phonemes, when these features/elements are studied rigorously as global statistics, they are studied as contours of mean value, standard deviation of fundamental frequency, energy distribution, and temporal changes in spectral coefficients like jitter and tremors, and sometimes when studied locally- pitch and energy contours.
So where does emotion fit in the above gobbledygook??
It has been found that sadness has been associated with low standard deviation of pitch and slow speaking rate, while anger implies higher pitch deviation and rate. But by just studying pitch deviation and speaking rate, one is most likely to fall in a trap of prosodic confusion rather than discern emotional qualities from it. For example, an interrogative sentence will most likely have wider pitch contour than affirmative sentence, which mean interrogative sentences will have higher standard deviation, which has nothing to do with emotional content!
So these measures of deviations and statistics are necessary conditions- but not sufficient conditions!
Therefore, researchers are toying with something called Hidden Markov Models(HMM), which works with state transitions. To study temporal behaviours of speech, not as stationary statistics but as concatenation of states of local feature statistics.
So far, people have experimented with different features of speech, running one or more HMM on one emotion, short time, semi continuous models and various kinds of mathematical frameworks.
Frankly, for this class project, I would be happy to just use someone's software just like a text to speech conversion software. But I cannot find any ready-to-use software for emotion recognition. Therefore, I am hoping to implement one such model before the end of the semester. But so far, no work to show!
Arturo suggested that I look from the eye of an artist or better yet; "hear from the ear of an artist", rather than work with obscure statistics and mathematical models. Or at least that's what I understood from that inspiring talk with Arturo! :)
I would request people to suggest ideas on different perspective to this problem of emotion recognition. People with music background? Sound engineers? theatre? Linguists? Psychics?!
Saturday, March 20, 2010
but what is it going to look like?
Hi everyone.
My drawing tools in Processing are coming along slowly but I realize now that I haven't addressed something just as important as doing research and putting in the time to learn - I haven't discussed how this will be presented! If their is one thing I have learned from Tufte, how you display everything is key to effective communication. I mean, I could just show everyone some lines of code but that's not exactly the goals of this project. I want to show the research as well as the tools I am developing.
The beauty of Processing is that it is java based so it's perfect for the web. So I have decided to make a website/blog that is easily updatable and easy for others to use. Processing sketches can easily be displayed as applets on blogs. Wordpress has some very simple clean templates that I can adapt to what I want so I think that this is where I'm going to put my work. Eventually I would like to buy my own domain and transfer all of my work there. I haven't decided if I am going to go the paid route, it seems like with the amount of data for this one project I would not have to. Plus, I have used blogger for several years and I would like to see if their is any difference.
My drawing tools in Processing are coming along slowly but I realize now that I haven't addressed something just as important as doing research and putting in the time to learn - I haven't discussed how this will be presented! If their is one thing I have learned from Tufte, how you display everything is key to effective communication. I mean, I could just show everyone some lines of code but that's not exactly the goals of this project. I want to show the research as well as the tools I am developing.
The beauty of Processing is that it is java based so it's perfect for the web. So I have decided to make a website/blog that is easily updatable and easy for others to use. Processing sketches can easily be displayed as applets on blogs. Wordpress has some very simple clean templates that I can adapt to what I want so I think that this is where I'm going to put my work. Eventually I would like to buy my own domain and transfer all of my work there. I haven't decided if I am going to go the paid route, it seems like with the amount of data for this one project I would not have to. Plus, I have used blogger for several years and I would like to see if their is any difference.
Uploading failed again
Processing failed again this week, even though my clip was in video, and not just sound (mp3) like last week. This week it was in Windows Movie Maker, which does not allow you to save in other extensions than the .MSWMM one. I wonder if Premiere allows to save in MP4?
So the issue is compatibility in file formats, if I'm understanding correctly. I do not believe there should be any other issue.
The question I have to resolve now is the conversion question: How to convert from Microsoft Windows Movie Maker MSWMM extension to MP4 extension?
I guess if Google Blogger allows MP4 uploads to process (which I hope I will do next week sans faute) then NING also does, as well as most Internet sites. Am I right?
But just for the sake of my effort this week, does anybody know of an Internet site that would let me upload my .MSWMM file extension? It is not very big, I could send it to myself through email successfully, I know when the file is too big the email prompts you that it is bigger than 10 MB and therefore you would have to switch to a paying version of the email, which would give you allowance for sending bigger size files.
Apart from this congratulations to Jeremiah Stanley for his award winning movie, and good luck to everyone.
So the issue is compatibility in file formats, if I'm understanding correctly. I do not believe there should be any other issue.
The question I have to resolve now is the conversion question: How to convert from Microsoft Windows Movie Maker MSWMM extension to MP4 extension?
I guess if Google Blogger allows MP4 uploads to process (which I hope I will do next week sans faute) then NING also does, as well as most Internet sites. Am I right?
But just for the sake of my effort this week, does anybody know of an Internet site that would let me upload my .MSWMM file extension? It is not very big, I could send it to myself through email successfully, I know when the file is too big the email prompts you that it is bigger than 10 MB and therefore you would have to switch to a paying version of the email, which would give you allowance for sending bigger size files.
Apart from this congratulations to Jeremiah Stanley for his award winning movie, and good luck to everyone.
Friday, March 19, 2010
Project update

The "0" represents space that can be walked through and the 'x' represents space that cannot. If you'll notice the layout goes:
item x item 0 item x item
the '0' would be the actual 'aisle'
We had a bit of a problem with the spacing of the matrix because the default for each 10 pixels, so I went back and sent the parameters for slightly smaller in areas. Hopefully, this will solve the spacing issue. I also put RGB values on all the categories to color code everything. Then next step is setting the algorithm...we'll see how that goes.
Wednesday, March 17, 2010


GUI for Processing
In response to Francesca's post here is a little sample of a GUI that can control x parameters by simply feeding the value of the sliders into whatever you need to change. Thanks Anton for integrating Zoog with Handles:-)
For now only the first two slides do something (change the size of the head) but you can download the source, open it in Processing and assign the other sliders to change color, position or whatever you want in your project. For example in the code:
ellipse(300,70, handles[0].length * 2, handles[1].length *2); handles[0] (the first handle) changes the size of the head in the X dimension and handles[1] in the Y
The reason it is multiplied by 2 is simply to extend the range since in the original code the handles are only giving values from 0 to 89 which was too small a change for the head. Experiment with that. Enjoy
Source code: Handles_Control
Tuesday, March 16, 2010
Fragile Bones
I just recently finished a new multimedia piece. This project won a university-wide competition at UF last week and it is now in a national competition against 160 other universities.
I'm hoping to get some feedback from you guys. So, when you watch it, think about if it makes sense. Like, what questions do you have? What did the piece not answer? and what do you want to know more about? Was it for a reason? Thanks everyone!
For better viewing, click on "vimeo" on the bottom right-hand corner and follow the link.
project update
I have been exploring making my own drawing tools within Processing that are similar to certain imaging editing programs but more custom to what I want to do. The following compositions were made very simply using the mouse and is less than a page of code. The idea is similar to an example on the Processing website. The actual drawing tool is a flower with five petals. I would like to add a GUI that would allow me to simply change the size of the ellipses and the range of colors. Any help would be appreciated.


Project Status Update
This is my project description and update:
A lot of people maintain a daily journal. Although emotion can be inferred from the journal text, it still remains indirect. Moreover, the trend in emotional change over a period of time remains hidden in the words and cannot be recognized.
We don't really keep track of our emotions directly. We keep track of events, problems, people, desires, dissapointments, etc wherein emotion is implicit.
For example, if one decides to be happy for a month, there is no objective way to test it. Compounding the problem is the fact that we are ourself deluded about our own emotional state at times.
This tool will help by directly monitoring the emotional state in the speech while the user records his/her journal.
This is the workflow of my project
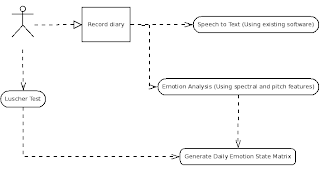
And every week, month a trend report will be generated highlighting the shift in emotion for the period concerned. A weekly report will look something like this:

This is work in progress. I am able to record voice, and convert speech to text after adaptation of speech grammar for a particular user. There is a shortage of good quality speaker independent speech recognition software in open source community, therefore my software will not be speaker independent. And there would be a training time for each user to properly convert speech to text.
The part of speech emotion recognition is still incomplete because I am waiting for my other class to cover some of the tools I will need for it!
I am using C++ on linux to code the software and GNUPlot to plot the trend graphs. Luscher test is going to be an optional feature for the project unless I get the book with color plates to implement it.
A lot of people maintain a daily journal. Although emotion can be inferred from the journal text, it still remains indirect. Moreover, the trend in emotional change over a period of time remains hidden in the words and cannot be recognized.
We don't really keep track of our emotions directly. We keep track of events, problems, people, desires, dissapointments, etc wherein emotion is implicit.
For example, if one decides to be happy for a month, there is no objective way to test it. Compounding the problem is the fact that we are ourself deluded about our own emotional state at times.
This tool will help by directly monitoring the emotional state in the speech while the user records his/her journal.
This is the workflow of my project
And every week, month a trend report will be generated highlighting the shift in emotion for the period concerned. A weekly report will look something like this:
This is work in progress. I am able to record voice, and convert speech to text after adaptation of speech grammar for a particular user. There is a shortage of good quality speaker independent speech recognition software in open source community, therefore my software will not be speaker independent. And there would be a training time for each user to properly convert speech to text.
The part of speech emotion recognition is still incomplete because I am waiting for my other class to cover some of the tools I will need for it!
I am using C++ on linux to code the software and GNUPlot to plot the trend graphs. Luscher test is going to be an optional feature for the project unless I get the book with color plates to implement it.
Monday, March 15, 2010
My project - Learning java script
A large part of my project is using script in a Web site. I've spent a lot of time lately trying to learn this. At the beginning of the semester Arturo said to pick a project using something you're already familiar with and expanding it with something you're not familiar with. I chose to build a Web site, which I'm familiar with HTML and CSS, and then expand my knowledge by learning to script as well.
I bought a Web site for my daughter (she's 4) to keep the family updated with new stuff as well as give her her own Web site she might need for whatever one day. I played around with some javascript and made a gallery of images using it. I'll be using some of this same script for my project. So, I just wanted to show the class some of what I've been working on lately as far as my project goes.
Art in Images
Like most of us in the class, art is an important part of my life. Also like most of us in the class, imagery is often the centerpiece of that art. I generally do photojournalistic/documentary photography which is generally less "arty" (except for following the basic principles of composition, lighting, framing etc.), but as a hobby I dabble in the art photo world which allows for much more manipulation.
I found this video that I really liked a lot. Not only does it show a cool way of physically manipulating photos, but it does it without verbally saying one word. There is some text, but the majority of information comes from imagery itself. I just thought the class would appreciate it.
Photo Manipulation: Zink-PoGo from Frenky on Vimeo.
Matrix
I have been working on my matrix for my grocery store to create the algorithm for the navigation and shortest/quickest route. It's too big to post. I created it in excel and it's about 13 pages long. The grid is 25x90. I used a "0" for spaces that one can walk through and an "x" for blocked paths.
The other fields have the name of the categories (dairy, produce, beer, wine, etc.) This is just a general layout of the store. Just to see if we can get it up and running. Later I will add the specific items and hopefully the entire inventory. I believe I now need to put it in csv form. I'm working on that now.
Sunday, March 14, 2010
PDF, MIDI and MP3
I wanted to post the MIDI version of Hymn to Joy, and MP3, of the same, after I added the Harmony part to it. But I don't know if and/or when it's going to process or successfully upload. So far it's processing... if it does, I will post it. Otherwise, I'll bring my computer with me Tuesday, and perhaps I can get help as to uploading this.
Is it possible to upload PDF file? If so, how?
I'm thinking of computers as making your life so simple when everything works, but so frustrating when it doesn't! So if you don't see or rather hear my post before Tuesday, it will mean I misearbly failed... But I will be proud at least that I tried!
Is it possible to upload PDF file? If so, how?
I'm thinking of computers as making your life so simple when everything works, but so frustrating when it doesn't! So if you don't see or rather hear my post before Tuesday, it will mean I misearbly failed... But I will be proud at least that I tried!
A question
Hey everyone, I'm working on a part of my solar visualization that I may need some help with - I want to input an address and receive latitude and longitude for the location. I know you can do this with google maps and I will need some sort of API, but before I messed with it too much I thought I would ask as I saw a few other projects that already had something similar. Maby it's too complicated to explain on here but I thought I'd ask anyway.
This site shows how to get lat and long from google maps:
http://lifehacker.com/267361/how-to-find-latitude-and-longitude
This site shows how to get lat and long from google maps:
http://lifehacker.com/267361/how-to-find-latitude-and-longitude
Friday, March 12, 2010
the 250 dollar cube that I can make for less than 50

 I was on the internet trying to see if I can get my plexi cut somewhere... and to my surprise I found this Ralph Lauren Puzzle cube, which is basically almost exactly what I intended to do in the beginning. I don't know if you guys remember the wooden cube I made as a prototype, and I explained to Arturo that it was going to be out of plexi... Well here it is. I was so mad when I saw it because I changed my project thinking that It was too simple, and now I see it online for 250 dollar. I can literary make this for less than 50 dollars - 30 dollar max.
Plexi
The colors I am planning to use for the project are yellow, green, blue, and red.
Unfortunately, I was not counting that Magnum Wood, the supply store, was going to be close for the break, so I can't provide you with an image of the colors I am going to be working with. But here is an image of colored plexi I got from google:
 To glue plexi together, you need to sand the edges till they are straight and smooth to create a better bond. If the pieces you are gluing together are already smooth and when put together make perfect contact, you don't have to sand it. Then with a syringe or a weld-on applicator, apply weld-on 3 (liquid) r weld-on 16 (gel). I particular like the liquid one because, if carefully done, the joint is seamless. The gel one is easier to use but it leaves a very rough joint. I usually use a mask to apply the weld-0n, since is quite toxic. Gloves are also recommended.

 weld-on applicator

To cut plexi I use an Olfa plexi cutter (I don't know any other tool that can be used by hand). Make sure to cut the plexi on top of a cutting mat or a surface that you don't care damiging. Also, use a straight ruler all the time while cutting. This is very important because if you free hand the cut, the Olfa is most likely to slide and you can seriously cut your hand.
 Plexi cutter
Unfortunately, I was not counting that Magnum Wood, the supply store, was going to be close for the break, so I can't provide you with an image of the colors I am going to be working with. But here is an image of colored plexi I got from google:
 To glue plexi together, you need to sand the edges till they are straight and smooth to create a better bond. If the pieces you are gluing together are already smooth and when put together make perfect contact, you don't have to sand it. Then with a syringe or a weld-on applicator, apply weld-on 3 (liquid) r weld-on 16 (gel). I particular like the liquid one because, if carefully done, the joint is seamless. The gel one is easier to use but it leaves a very rough joint. I usually use a mask to apply the weld-0n, since is quite toxic. Gloves are also recommended.
 weld-on applicator
To cut plexi I use an Olfa plexi cutter (I don't know any other tool that can be used by hand). Make sure to cut the plexi on top of a cutting mat or a surface that you don't care damiging. Also, use a straight ruler all the time while cutting. This is very important because if you free hand the cut, the Olfa is most likely to slide and you can seriously cut your hand.
 Plexi cutter
Monday, March 8, 2010
Beethoven's Hymn to Joy-visualization of single melody score

This is the second attempt. If it duplicates, excuse the repetition. I've turned around so many programs to get to be able to display this in its current format.
What I have here is the visual component of the single melody score. Now I will be so grateful if anyone could tell me how to insert the sound as well, knowing that I will have it available as MP3 format.
Of course for this and other music scores visualizations on my website it's going to be much clearer than here, for I will have to only go from TIFF to Photoshop, whereas this blog does not accept TIFF so I had to go from TIFF to Power Point, from Power Point to JPEG... and last from JPEG to this blog!
I enjoyed the reading of all posts, I found especially funny the one with the social interactions clothing, this is hilarious... Good luck to everyone with your projects and Happy Spring Break. A la prochaine!
Sunday, March 7, 2010
When organisms sing...
Did you know that hydrogen emits a sound? So does oxygen and other elements that I can't spell. This video is about bringing art, science, and engineering into a new age of math, science and art. I am impressed! I really like the fact that by using such technology it could help advancing medicine.
My Site Map
This is my site map. I meant to post it earlier, but kept forgetting. Please leave me feedback. I have started my mock ups, which further explain some of the details a site map cannot.


Subscribe to:
Posts (Atom)